Book review: “OpenLayers 2.10 Beginner’s Guide” by Erik Hazzard

Disclaimer I: The book publisher PACKT Publishing provided me with a free copy of the book in order to get a review from me.

Disclaimer II: I am the Coauthor of a German book on OpenLayers and other FOSS components that one can use to build great WebGIS applications.

The book “OpenLayers 2.10 Beginner’s Guide” is a hands-on introduction to the OpenSource JavaScript library OpenLayers. It aims to help (first-time) users of OpenLayers to get a good grasp of what the library is capable to do and how one can create great webbased maps with JavaScript. The author Erik Hazzard covers basic (Introduction into object-oriented programming, working with Firebug, etc) and more advanced topics in 10 chapters on more than 300 pages.

To be honest: I was quite happy to have another whole book dedicated to one of my most loved software projects, and this time in English. In my opinion it is very important to have documentation in the form of written books and not only as autogenerated API-docs and online examples.

These are the chapters of the book:

  1. Getting Started with OpenLayers
  2. Squashing Bugs With Firebug
  3. The ‘Layers’ in OpenLayers
  4. Wrapping Our Heads Around Projections
  5. Interacting with Third Party APIs
  6. Taking Control of Controls
  7. Styling Controls
  8. Charting the Map Class
  9. Using Vector Layers, available as free sample chapter
  10. Making Web Map Apps

As the cover suggests (“Learn by doing: less theory, more results”) the focus of the book is on example usage of code and a description of the options one has when interacting with OpenLayers.

I personally think it was a mistake to put the version number of OpenLayers into the title of the book. As this review is being published, the first Release Candidate of 2.11 can be downloaded and tested, so the book seems outdated (while of course in reality most parts of the book are not outdated). Despite of the 2.10-title, the book also contains some reference to version 2.9 of OpenLayers (e.g. page 65 and page 155). I cannot say whether this is just a minor editing error or something else. Erik Hazzard sometimes has reference to non-API properties in his text which is a big mistake in my eyes (e.g. the “properties of a layer”-table on page 67 ff.). As far as I can tell there is no layer property “metadata” that is expected to be set by a user. Please correct me if I am wrong here or if you do not see a problem when non-API properties get promoted in this book. I am open to other opinions. There are some editing mistakes in the book (mainly upper-/lower-case errors) but not to much to be really disruptive.

What I really like is the amount of aspects of OpenLayers covered in the book. You will certainly learn a lot reading this book. The book is easy to read and Erik Hazzard explains things most of the time adequately yet entertaining. The book is driven by a playfull and iterative approach. The additional information in the book (Working with Firebug, Projections, OOP …) will help many readers, The final full web map application shows how to combine the parts discussed in earlier chapters.

Summary: This book does a good job at covering basics and some more detailled aspects of developing map-applications with OpenLayers. It does on the other hand also contain some information that might mislead a user in developing upgradeable and stable web GIS sites. As it is a good read overall and does cover lots of side aspects of developing map applications it is definitely a help when novice users try to delve into the depth of OpenLayers. The target group of the book, OpenLayers beginners, will learn a lot while being well entertained. Buy this book if you are about to develop your first maps with OpenLayers, but please double check with the current project API-documentation whether the properties exist and you are safe in using (and depending) on them.

I rate it with 8 out of 10 possible points.

Edit 2011-05-30, removed typos
One post every 12 months… stick to your schedule

With shock I realised that I had left this blog more or less untouched for roughly 12 Months now. Embarassing. I hope that in the future I’ll find the time to publish more often.

Now, what did I do the last year?

Beneath other interesting things: I was in Sydney, Australia, and spoke at the FOSS4G 2009, wrote and published a book about OpenLayers and the OSGeo WebGIS software stack, held the keynote at FOSSGIS 2010 about HTML5 and ECMAScript 5 and have a PostGIS talk together with Nicklas Avén accepted at the next FOSS4G in Barcelona, Spain. All in all I have to say that this was a great year with many interesting phases.

Hopefully I’ll be able to go into detail what I did this last twelve months with some follow-up posts soon.

My presentation submission is accepted: I am going to Sydney, Australia for FOSS4G

Logo of the FOSS4G 2009, Sydney, Australia

Logo of the FOSS4G 2009, Sydney, Australia


Last Monday, on the 20th of July, I got an email from the organisation comitee of the annual FOSS4G conference stating that my submitted talk was accepted.
I am proud to have the opportunity to share my thoughts on “Comparing apples and oranges: Uncovering the mystery of component selection in WebGIS projects”. The talk will mainly deal with uncertainty when faced with technologigal decisions concerning component selection for WebGIS projects.
This years FOSS4G takes place in Sydney, Australia from 20th to 23rd of October. I eagerly anticipate meeting with many of the big players in the Free and OpenSource GIS Community.
After the conference is over, I want to stay for vacation in Australia and explore the eastern coast… staring out of the window to see the cloudy Bonn, I really wish I was there already.

A commandline-preciousness for converting filename encoding in Linux: convmv

I want to share a very usefull Linux software I discovered yesterday: convmv. This tool converts filenames from one encoding to another… and it does it well.
I was facing warnings from my Ubuntu filesystem when viewing the contents of a folder I just copied there. The contents of that particular folder were various pictures of various sources. And apparently different filename-encodings were used: Ubuntu complained “(ungültige Kodierung)” (that is german for illegal encoding) on files with german umlauts that originally came from some sort of Windows operating system. I guessed that these filenames were encoded in cp1252.
I wanted to have a tool to do the filename conversion for me, and faintly remembered stumbling on such a software once. Google helped and with a quick

sudo apt-get install convmv

I was ready to check if convmv did the job for my situation. I issued a

convmv -f cp1252 -t utf8 *

in the folder containing the file with illegal encoding and … yes: works like a charm. Actually the above command will only print out a list of conversions that would be done, no actual mv command is executed. If you like what you see, you can actually execute the recoding using:

convmv -f cp1252 -t utf8 --notest *

This a very nice tool and it absolutely saved my day.

Posted in linux. 2 Comments »

PGCon 2009 is over… read submitted material online

pgcon2009_logo

From 19th to 21st May 2009 the PGCon 2009 took place in the University of Ottawa. Although I could not participate personally, I can attend virtually.

From the website http://www.pgcon.org/2009/ slides of presentations or material of workshops can be obtained. Man, I love the WWW!
Here is a small excerpt of what I found very interesting at first sight:

I can only hope to have the chance to participate next time in 2010.

Diploma thesis “Digitale geomorphologische Kartographie – Potenziale der Informationstechnologie zur Weiterentwicklung eines geowissenschaftlichen Kartenwerks” (German)

The minimalistic frontpage of the thesis

The minimalistic frontpage of the thesis

I recently have been asked for a digital version of my diploma-thesis I wrote 2 years and 3 months ago. I could only respond with a long URL to the PDF which is located on the servers of my employer. But I did not have a small description about the work so I decided to republish the thesis here on this blog.

First things first: Download the complete thesis (without appendix) from here:Diploma thesis “Digitale geomorphologische Kartographie – Potenziale der Informationstechnologie zur Weiterentwicklung eines geowissenschaftlichen Kartenwerks” by Marc Jansen (German, PDF, roughly 9.9MB, 130 pages).

Of course the URL can be shortened: http://tinyurl.com/da-jansen… this might be easier to remember.

The table of contents reads (again German):

  1. Einleitung
    1. Relevanz des Themas
    2. Zentrale Fragestellungen
    3. Ziele der Arbeit
    4. Gliederung der Arbeit
  2. Theoretischer Hintergrund
    1. Geomorphologie und geomorphologische Karte
    2. Das geomorphologische System
    3. Kartographie
    4. Entwicklung geowissenschaftlicher Kartenwerke
      1. Bodenkarte und geologische Karte
      2. Geomorphologische Karte
    5. Geographische Informationssysteme
    6. Geodaten und ihr Markt
    7. Informationstechnologie
    8. Zusammenfassung des Kapitels
  3. Methodik
    1. Vorgehensweise
    2. Auswahl der Methodik
    3. Experteninterviews
    4. Auswahl der Experten
    5. Datenerhebung
    6. Datentranskription
    7. Datenauswertung und qualitative Inhaltsanalyse
    8. Gütekriterien qualitativer Sozialforschung
    9. Zusammenfassung des Kapitels
  4. Ergebnisse
    1. Entwickelte Kategorien
    2. Quantifizierende Materialübersichten
    3. Qualitative Materialauswertung
      1. Grundlagen einer Weiterentwicklung
        • Bedeutung der geomorphologischen Karte
        • Ziel der geomorphologischen Karte
        • Tatsächlicher Nutzerkreis der Karte
      2. Rahmenbedingungen einer Weiterentwicklung
        • Rahmenbedingungen der Geomorphologie
        • Rahmenbedingungen geomorphologischer Kartographie
        • Rahmenbedingungen der Informationstechnologie
        • Sonstige Rahmenbedingungen
      3. Potenziale einer Weiterentwicklung
        • Datenaufnahme und -sammlung
        • Datenhaltung und -verwaltung
        • Datenpräsentation und -darstellung
        • Intersubjektivität und Objektivierung
        • Integration und Effizienz
        • Schnittstellenschaffung
    4. Bewertung der Methodik
    5. Zusammenfassung des Kapitels
  5. Diskussion und Ausblick
  6. Fazit
  7. Zusammenfassung der Arbeit
  8. Literaturangaben

I plan to translate the summary to english, so there might come updates for this post.

Alternative download location (for the rather unlikely event of my employer deciding to not host the file anymore) of the complete thesis (without appendix): Diploma thesis “Digitale geomorphologische Kartographie – Potenziale der Informationstechnologie zur Weiterentwicklung eines geowissenschaftlichen Kartenwerks” by Marc Jansen (German, PDF, roughly 9.9MB, 130 pages)

UPDATE 2009-05-25: fixed typos, added tags and categories.
UPDATE 2009-07-03: added alternative download location.

Finally: a cheatsheet for OpenLayers 2.7

The cheatsheet for OpenLayers

The cheatsheet for OpenLayers

Since FOSSGIS 2009 is over, I now have the time to announce version 0.1 of a cheatsheet for OpenLayers (version 2.7).

The cheatsheet was compiled by Dennis – a collegue of mine at terrestris – and me. For now there is only a PDF-version available, but we plan to have the cheatsheet released as HTML as well. The PDF-version should look great when printed out – the HTML version should enable you to copy and paste important parts directly from the cheatsheet into your own OpenLayers application.

As for now we only cover very basic parts of OpenLayers: The Map-object, the Layer-object and the Control-object. All of these have certain common methods and properties listed and should help you to get a very quick grasp of the object in case. Additionally we put in the obvious “Hello-World”-example… in this particular case more or less litarally.

The cheatsheet is not an official part of the OpenLayers project or its documentation but is released under the same free license. Both Dennis and I myself are glad that our company terrestris hosts the document on their site.

This is an early version. There might be wrong information in the cheatsheet. Do not hesitate to contact us and comment on the document. Our adresses should be easy to spot in the pdf-file.

New minor release of Geoserver available: version 1.7.3 is there

The logo of geoserver

The logo of geoserver

The geoserver team announced yesterday the release of Geoserver 1.7.3. I am rather excited to test the new features and improvements soon.

The full list of changes / fixes is long and includes two which I find very interesting:

  • the new REST interface,
  • the inclusion of the WMS tiling client GeoWebCache, for previous versions this “only” was an extension.

I hope to delve deep into this version of Geoserver, as I like the product very much in general.

Reprojecting / snapping point-geometries onto a given line-geometry using PostGIS

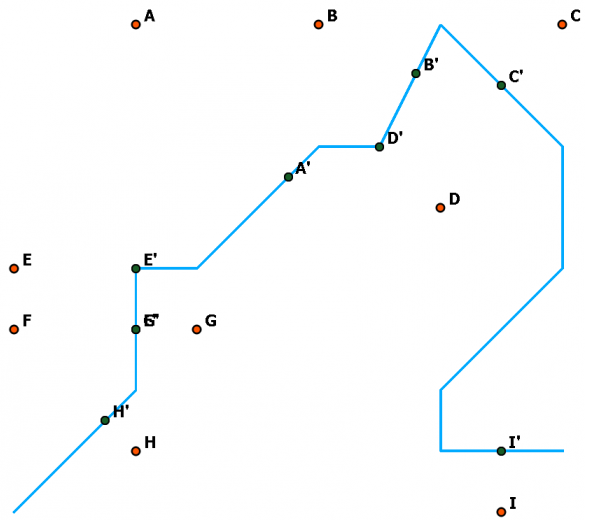
Imagine you have a line — a street for example — and point measurements taken while being on that street. Due to certain circumstances — e.g. GPS-coorrdinates are slightly inaccurate –, the coordinates of your measurements are not exactly on the street.

We had this problem just recently and needed to reproject the points onto the said line, here is what we wanted to achieve:


The points from A-I are being projected onto the blue Line resulting in points A' - I'

The points from A-I are being projected onto the blue Line resulting in points A' - I'

Thanks to the PostGIS Mailing list, here is a way to do just that

SELECT ST_Line_Interpolate_Point(
		line_to_project_onto.the_geom,
		ST_Line_Locate_Point(
			line_to_project_onto.the_geom,
			points_to_project_onto_line.the_geom
		)
	)
FROM line_to_project_onto, points_to_project_onto_line;

Note: “line_to_project_onto” is a table containing one record: the line-geometry, “points_to_project_onto_line” is a table where all points are stored which should be snapped to the line, “points_projected_onto_line” — from the next example — is the table to store the reprojected points in. Here are short definitions from the PostGIS-SVN-Documentation

  • ST_Line_Interpolate_Point – Returns a point interpolated along a line. Second argument is a float8 between 0 and 1 representing fraction of total length of linestring the point has to be located (Documentation).
  • ST_Line_Locate_Point – Returns a float between 0 and 1 representing the location of the closest point on LineString to the given Point, as a fraction of total 2d line length (Documentation).

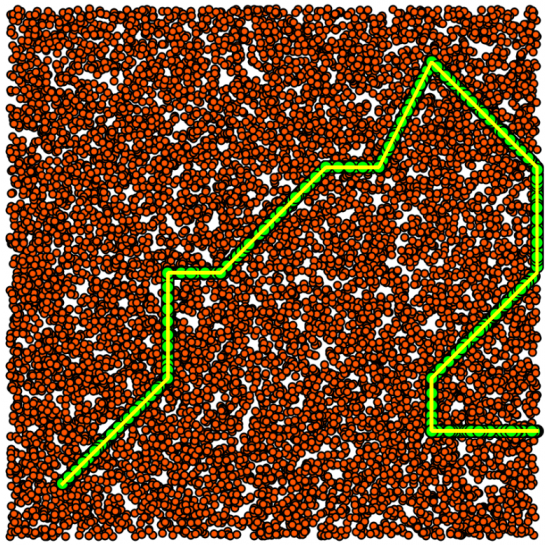
Let’s test it with 10.000 random points:

TRUNCATE points_to_project_onto_line;
TRUNCATE points_projected_onto_line;

INSERT INTO points_to_project_onto_line ( the_geom )
	SELECT st_makePoint( random() * 10, random() * 10) FROM generate_series(1,10000);

INSERT INTO points_projected_onto_line ( the_geom )
SELECT 	line_interpolate_point(
		line_to_project_onto.the_geom,
		line_locate_point(
			line_to_project_onto.the_geom,
			points_to_project_onto_line.the_geom
		)
	)
FROM line_to_project_onto, points_to_project_onto_line;

10.000 reddish points snapped to the yellow line. The reprojected points are displayed as bigger green circles and it shows that there is no maverick.

10.000 reddish points snapped to the yellow line. The reprojected points are displayed as bigger green circles and it shows that there is no maverick.

Seems to work well. As usual with PostgreSQL / PostGIS 🙂

Changes:
09:10h Updated image captions

Developing fun: ST_StarAtPoint for PostGIS

As christmas is coming closer, I want to share a small PostGIS-function that generates a star at a given point with some other specified characteristics. This function has not been built with a special use-case in mind, but just for fun. Yet, I hope someone finds this functionality interesting.

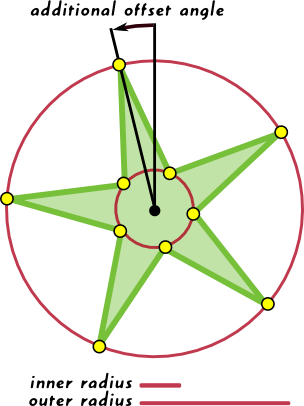
OK, so what is a star? When I am talking about a star I mean a polygon consisting of at least 3 spikes which are equally distributed along a circle. The following picture describes best what I want I understand as a “star”:

Anatomy of the stars created by the function

Anatomy of the stars created by the function

With Postgis I want to create stars that look like the the green polygon above. When one defines the center coordinate (the black spot in the center of the star), the number of spikes, and the length of both inner and outer radius (red lines), and an additional offset (in degrees, see the black arrow on top of the star), we are able to create all needed corners of the polygon (marke yellow above).

I will show two ways to compute everything we need, a readable, “processual” one and a more “geeky” one with only one line of SQL.

Let’s create an empty dummy function with all arguments we need, the logic will be inserted later:


CREATE OR REPLACE FUNCTION ST_StarAtPoint(
  IN point geometry,
  IN inner_radius numeric,
  IN outer_radius numeric,
  IN number_of_spikes integer,
  IN additional_rotation_degrees numeric
) RETURNS GEOMETRY AS
$body$
  DECLARE
  BEGIN
    -- For the moment we'll always return a simple point geometry
    RETURN 'POINT(0 0)'::geometry;
  END;
$body$
LANGUAGE plpgsql;

We are now able to call the above function. This does not make too much sense right now, but to test for typos it should do the trick:

SELECT ST_AsText(ST_StarAtPoint('POINT(0 0)'::geometry, 1, 5, 8, 0));

Now let’s add code to check if we have been called with valid parameters:


IF (inner_radius > outer_radius) THEN
  RAISE EXCEPTION 'Inner radius must not be greater than outer radius.';
END IF;
IF (number_of_spikes < 3) THEN
  RAISE EXCEPTION 'A star must have at least three spikes.';
END IF;

Also, we will calculate the radians of the given degrees

angle = radians(360/number_of_corners);
additional_rotation_angle = radians(additional_rotation_degrees);

For all the variables we need to have a valid declaration. We’ll add four more variables to the declarations, the declartion section now looks like this:


-- the star geometry variable as WKT
star_geometry_wkt text := '';
-- a loop counter
i integer := 0;
-- the angle defined by 360° / number of spikes 
angle numeric;
-- an optional "offset"
additional_rotation_angle numeric;
-- the baseline we will rotate around for the inner points
baseline_inner geometry;
-- the baseline we will rotate around for the outerpoints
baseline_outer geometry;
-- the point we rotate around
rotation_point geometry := 'POINT(0 0)'::geometry;

-- construction of the lines to rotate 
baseline_outer = ST_RotateZ(
  ST_MakeLine(rotation_point, ST_MakePoint(
    ST_X(rotation_point),
    ST_Y(rotation_point) + outer_radius)
  ), additional_rotation_angle);
baseline_inner = ST_RotateZ(
  ST_MakeLine(rotation_point, ST_MakePoint(
    ST_X(rotation_point), 
    ST_Y(rotation_point) + inner_radius)
  ), additional_rotation_angle + (angle/2));

Now baseline_outer should contain a linestring from Point(0 0) to Point(0 radius_outer) (think twelve o’ clock) and slightly rotated counter-clockwise. The same is true for baseline_inner, but this line is roitated half the general angle agin counter-clockwise, so that inner points always lie exactly in the middle between two outer points.

We are now iterating through all needed spikes and add WKT-strings (not so elegant, I know) two our star_geometry_wkt-variable:


WHILE (i < number_of_corners) LOOP
  -- add point to polygon for outer-spike
  -- note that we are adding the appropriate coordiantes from the input-geometry
  star_geometry_wkt = star_geometry_wkt 
    || (ST_X(ST_EndPoint(ST_RotateZ(baseline_outer, angle * i))) + ST_X(point)) 
    || ' ' 
    || ST_Y(ST_EndPoint(ST_RotateZ(baseline_outer, angle * i))) + ST_Y(point) 
    || ',';
  -- add point to polygon for inner-spike
  -- note that we are adding the appropriate coordiantes from the input-geometry
  star_geometry_wkt = star_geometry_wkt 
    || (ST_X(ST_EndPoint(ST_RotateZ(baseline_inner, angle * i))) + ST_X(point)) 
    || ' ' 
    || ST_Y(ST_EndPoint(ST_RotateZ(baseline_inner, angle * i))) + ST_Y(point) 
    || ',';
  -- increment counter
  i = i + 1;
END LOOP;

Finally, let’s finish the WKT string and add the first point again so the linestring is closed.


star_geometry_wkt = star_geometry_wkt ||  (ST_X(ST_EndPoint(baseline_outer)) + ST_X(point))  || ' ' ||  (ST_Y(ST_EndPoint(baseline_outer)) + ST_Y(point));
star_geometry_wkt = 'POLYGON((' || star_geometry_wkt || '))';
RETURN star_geometry_wkt::geometry;

Here is the complete code of the star-function.

Of course it is possible to build the function with SQL only (Heres the source of ST_StarAtPoint with 1 SQL query only).

Now let’s see if any of the function works:


CREATE TABLE star_test AS
  SELECT 
    ST_StarAtPoint(ST_MakePoint(random()*400, random()*400),1, 1 + ii, iii, i) AS the_geom
  FROM 
    generate_series(1,50) i, 
    generate_series(1,3) ii,
    generate_series(5,10) iii;
-- add a primary key for QGIS
ALTER TABLE star_test ADD COLUMN id SERIAL;
ALTER TABLE star_test ADD PRIMARY KEY (id);

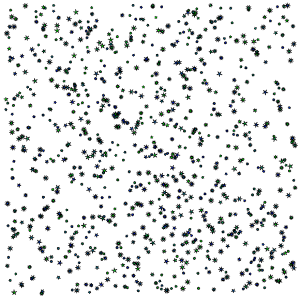
When viewed in QGIS, one should see a star-field similar to this one:

Overview of the 900 stars inserted

Overview of the 900 stars inserted

Magnified view of the stars

Magnified view of the stars

A detail showing four stars we just created

A detail showing four stars we just created